In the world of crypto trading, one of the key challenges for traders is identifying potential trend reversals. Reversal candlestick patterns are powerful tools that can assist in this endeavor. These patterns provide valuable insights into potential changes in the direction of an asset’s price movement, signaling when an upward or downward trend may be coming to an end or when a new trend may be emerging. In this article, we will explore various bullish, bearish, and neutral reversal candlestick patterns that traders can utilize to enhance their trading strategies.
Bullish Reversal Candlestick Patterns:
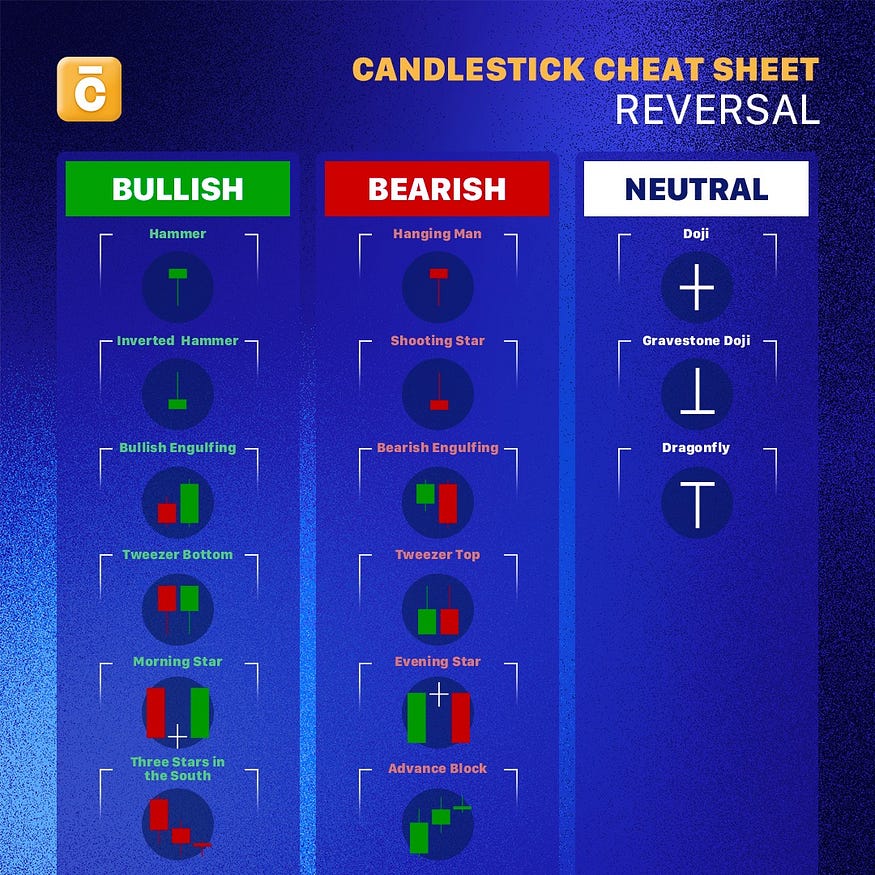
- Hammer: The hammer pattern appears after a downtrend and indicates a potential reversal. It is characterized by a small body and a long lower wick, resembling a hammer. The long lower wick suggests that buyers are stepping in, pushing the price higher from its lows.
- Inverted Hammer: Similar to the hammer pattern, the inverted hammer also occurs after a downtrend. It has a small body and a long upper wick, resembling an inverted hammer. This pattern suggests a potential trend reversal, with buyers gaining control after an extended decline.
- Bullish Engulfing: The bullish engulfing pattern occurs when a small bearish candle is followed by a larger bullish candle that completely engulfs the previous candle. This pattern signifies a shift in market sentiment from bearish to bullish, indicating a potential trend reversal.
- Tweezer Bottom: The tweezer bottom pattern forms when two candlesticks have equal or near-equal lows. It suggests that the market has found support at that price level, indicating a potential reversal from a downward trend.
- Morning Star: The morning star pattern consists of three candlesticks. It starts with a long bearish candle, followed by a small bearish or bullish candle with a gap, and ends with a long bullish candle. This pattern indicates a potential reversal from a downtrend and suggests a shift towards bullish momentum.
- Three Stars in the South: This pattern involves three small bullish candles that follow a downtrend. It signifies a potential trend reversal, with buyers gaining control and pushing the price higher.
Bearish Reversal Candlestick Patterns:
- Hanging Man: The hanging man pattern appears after an uptrend and suggests a potential trend reversal. It has a small body and a long lower wick, resembling a hanging man. This pattern indicates that sellers may be entering the market, potentially leading to a price decline.
- Shooting Star: Similar to the hanging man pattern, the shooting star occurs after an uptrend. It has a small body and a long upper wick, resembling a shooting star. This pattern signals a potential reversal, with sellers gaining momentum and pushing the price lower.
- Bearish Engulfing: The bearish engulfing pattern occurs when a small bullish candle is followed by a larger bearish candle that completely engulfs the previous candle. This pattern suggests a shift in market sentiment from bullish to bearish, indicating a potential trend reversal.
- Tweezer Top: The tweezer top pattern forms when two candlesticks have equal or near-equal highs. It suggests that the market has encountered resistance at that price level, indicating a potential reversal from an upward trend.
- Evening Star: The evening star pattern consists of three candlesticks — a long bullish candle, followed by a small bearish or bullish candle with a gap, and ending with a long bearish candle. This pattern indicates a potential reversal from an uptrend and suggests a shift towards bearish momentum.
- Advance Block: The advance block pattern occurs when three consecutive bullish candles show signs of weakening. It suggests that buyers are losing momentum and that a potential trend reversal may occur.
Neutral Reversal Candlestick Patterns:
- Doji: The doji pattern has a small body and indicates market indecision or equilibrium between buyers and sellers. It suggests that a trend reversal could be imminent.
- Gravestone Doji: Similar to a doji, the gravestone doji has a long upper wick and suggests a potential trend reversal from an uptrend. It indicates that sellers may be gaining control, potentially leading to a price decline.
- Dragonfly: The dragonfly pattern, similar to a gravestone doji, has a long lower wick and suggests a potential trend reversal from a downtrend. It indicates that buyers may be gaining control, potentially leading to a price increase.
Incorporating reversal candlestick patterns into a trading strategy can provide traders with valuable insights into potential trend reversals. However, it’s important to remember that these patterns should be used in conjunction with other technical indicators and analysis techniques for a comprehensive trading approach. As always, traders should conduct thorough research and exercise caution before making any investment decisions.
Disclaimer: This content is for informational purposes only and should not be construed as financial or investment advice. Always conduct your own research and consult with a qualified financial advisor before making any investment decisions.
The Centurion Invest Team.
Connect with Us: